Free Access
Fig. 5
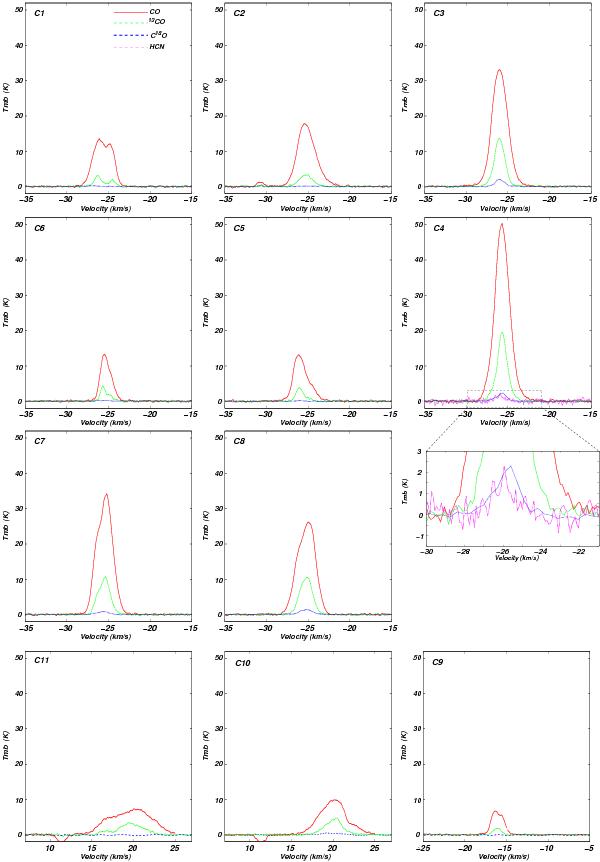
CO, 13CO, and C18O averaged line spectra obtained towards the molecular clumps C1 to C11. For C4, the spectrum of HCN is shown in the inset.
Current usage metrics show cumulative count of Article Views (full-text article views including HTML views, PDF and ePub downloads, according to the available data) and Abstracts Views on Vision4Press platform.
Data correspond to usage on the plateform after 2015. The current usage metrics is available 48-96 hours after online publication and is updated daily on week days.
Initial download of the metrics may take a while.