Fig. 4
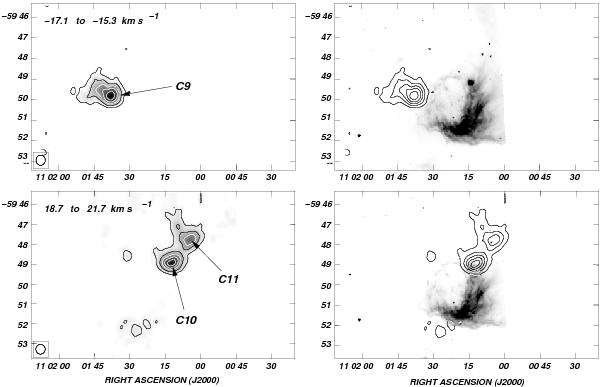
Left panels: integrated 13CO emission in the velocity range from ~−17.1 km s-1 to −15.3 km s-1 (upper panel), and from 18.7 km s-1 to 21.7 km s-1 (lower panel). The velocity interval of each image is indicated in the upper-left corner. In the upper panel, the lowest 13CO temperature contour is 0.35 K km s-1 (~5 rms) and the contour spacing temperature is 0.7 K km s-1. In the lower panels, the lowest 13CO temperature contour is 0.75 K km s-1 (~15 rms) and contour spacing temperature is 1 K km s-1. The beam size is shown by a circle in the lower-left corner of each image. Right panels: overlay of the IRAC GLIMPSE 4 (8 μm) emission of NGC 3503 (grayscale) and the mean 13CO emission in the velocity intervals shown in the left panels (contour lines).
Current usage metrics show cumulative count of Article Views (full-text article views including HTML views, PDF and ePub downloads, according to the available data) and Abstracts Views on Vision4Press platform.
Data correspond to usage on the plateform after 2015. The current usage metrics is available 48-96 hours after online publication and is updated daily on week days.
Initial download of the metrics may take a while.