Fig. 10
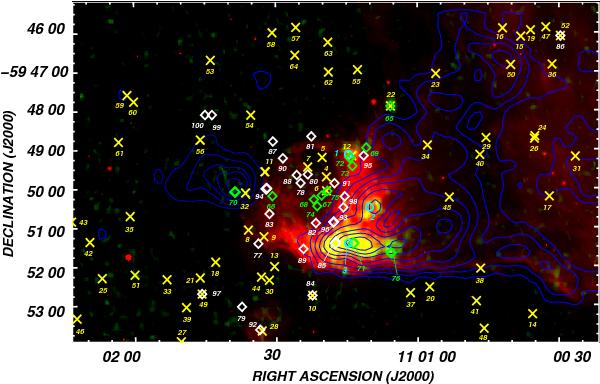
Composite image of NGC 3503 and its environs. The red color shows the IRAC-GLIMPSE emission at 8.0 μm, while green/yellow tonalities show the ATLASGAL 870 μm continuum emission. The 13CO(J = 2 → 1) emission line integrated in the velocity ranges from −27.8 km s-1 to −23.7 km s-1 and −17.1 km s-1 to −15.3 km s-1 are shown in blue contours. Thick light blue circles indicate the position of the MSX CHii region candidates, while yellow crosses depict the position of the 2MASS sources with IR excess. Green and white diamonds indicate the position of WISE Class I and Class II candidate YSOs, respectively. Numerical references of YSOs are based on Tables 5 and 6. The size of the symbols do not match the angular size of the sources.
Current usage metrics show cumulative count of Article Views (full-text article views including HTML views, PDF and ePub downloads, according to the available data) and Abstracts Views on Vision4Press platform.
Data correspond to usage on the plateform after 2015. The current usage metrics is available 48-96 hours after online publication and is updated daily on week days.
Initial download of the metrics may take a while.