Fig. 9
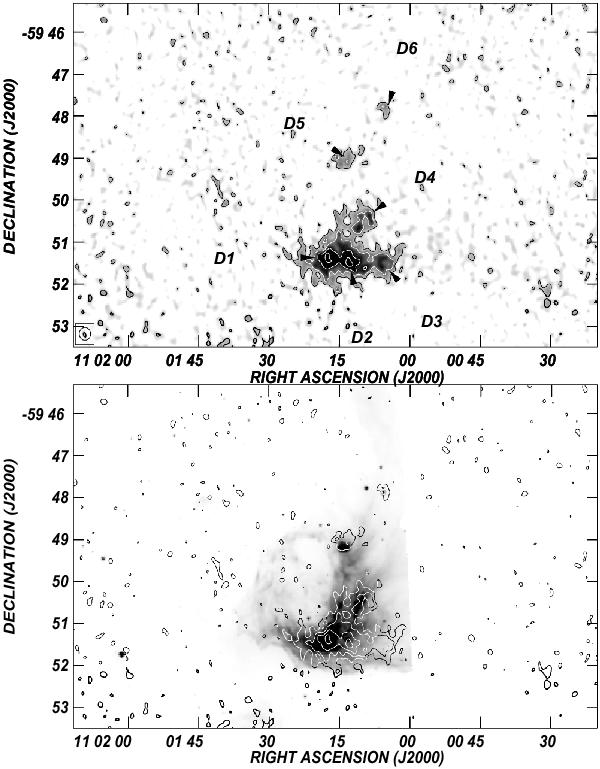
Upper panel: 870 μm continuum emission map from ATLASGAL. The grayscale goes from 50 mJy beam-1 to 500 mJy beam-1. Contour levels correspond to 150 (~2.5 rms), 300, 500, and 700 mJy beam-1. Bottom panel: overlay of IRAC image at 8 μm and the coutour levels of the upper panel. The grayscale goes from 10 MJy ster-1 to 180 MJy ster-1.
Current usage metrics show cumulative count of Article Views (full-text article views including HTML views, PDF and ePub downloads, according to the available data) and Abstracts Views on Vision4Press platform.
Data correspond to usage on the plateform after 2015. The current usage metrics is available 48-96 hours after online publication and is updated daily on week days.
Initial download of the metrics may take a while.