Fig. 1
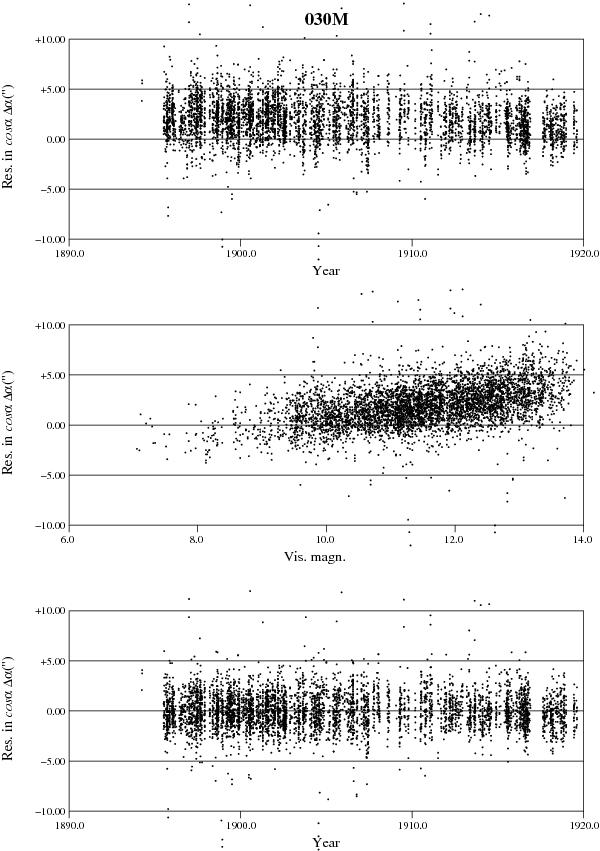
Magnitude equation in right ascension for the visual micrometer observations made at 030 Arcetri (5147 observations, 1894–1919). Top graph: residuals versus time, uncorrected (μ = +1.94″, σ = 2.07″). Middle graph: residuals versus visual magnitude of the asteroid; the least-squares regression line is R = −6.92 + (0.77 ± 0.01)MV. Bottom graph: residuals versus time after magnitude correction (μ = 0.00″,σ = 1.86″).
Current usage metrics show cumulative count of Article Views (full-text article views including HTML views, PDF and ePub downloads, according to the available data) and Abstracts Views on Vision4Press platform.
Data correspond to usage on the plateform after 2015. The current usage metrics is available 48-96 hours after online publication and is updated daily on week days.
Initial download of the metrics may take a while.