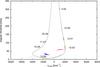
Fig. 7
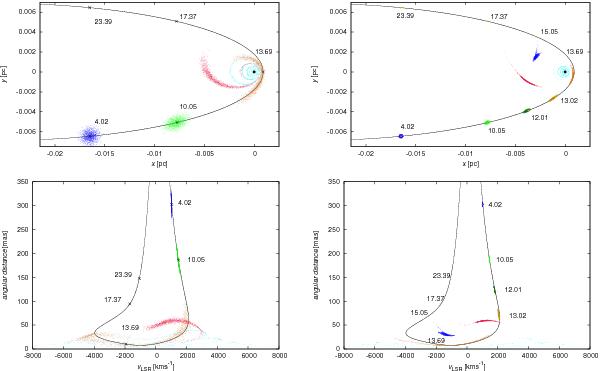
Numerical representation of the dust/gas cloud in terms of elementary parcels, trajectories of which are integrated in the gravitational field and influenced by the hydrodynamical drag. Top left: the evolution of the cloud in the orbital plane for selected epochs since the start of the simulation. Snapshots of the cloud are distinguished by different colours and shown at several moments of time (time marks correspond to years since the initial moment of integration). The cloud particles are characterised by the Gaussian dispersion around the nominal trajectory in the phase space (the black curve). Bottom left: representation of the evolution from the top-left panel is shown in the velocity-distance plane. The velocity is transformed into the local standard of rest. The angular distance is expressed in miliarcseconds. Top right: the evolution as in the top-left panel, but for a cloud with an embedded star in the core. Bottom right: the track in the velocity-position plane corresponding to the trajectory from the top-right panel.
Current usage metrics show cumulative count of Article Views (full-text article views including HTML views, PDF and ePub downloads, according to the available data) and Abstracts Views on Vision4Press platform.
Data correspond to usage on the plateform after 2015. The current usage metrics is available 48-96 hours after online publication and is updated daily on week days.
Initial download of the metrics may take a while.