Fig. 13
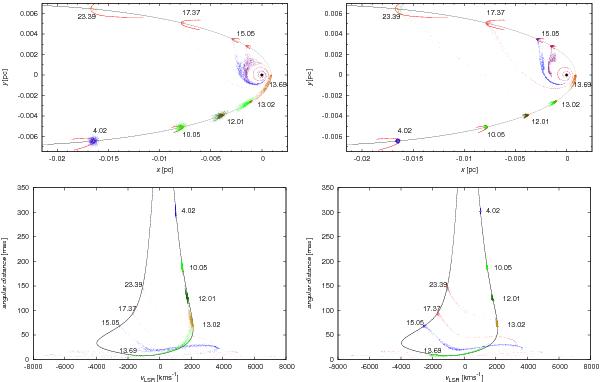
Analogy to Fig. 7 for the case with the bow-shock. Top left: the evolution of an initially spherical Gaussian envelope in the presence of a star for chosen epochs since the start of the simulation. Bottom left: representation of the evolution from the top-left panel is shown in the velocity-distance plane. The angular distance is expressed in miliarcseconds. Top right: as in the top-left panel, but for a star-disc system. Bottom right: the track in the velocity-position plane corresponds to the trajectory from the top-right panel.
Current usage metrics show cumulative count of Article Views (full-text article views including HTML views, PDF and ePub downloads, according to the available data) and Abstracts Views on Vision4Press platform.
Data correspond to usage on the plateform after 2015. The current usage metrics is available 48-96 hours after online publication and is updated daily on week days.
Initial download of the metrics may take a while.