Free Access
Fig. 8
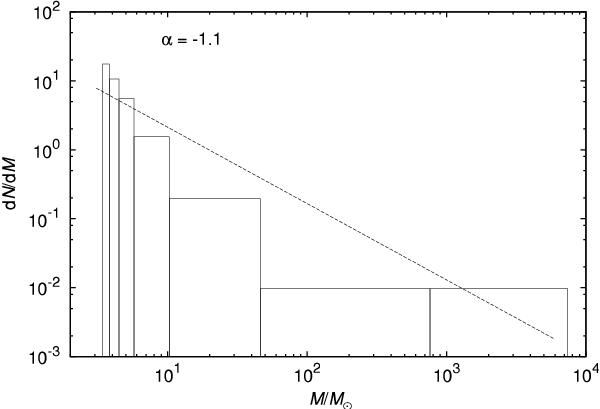
Histogram of the mass spectrum of molecular clumps associated with bubble N107. The bin widths are variable, set so that each bin contains seven clumps. The dashed line represents the best fitting power-law function with the index α = −1.1.
Current usage metrics show cumulative count of Article Views (full-text article views including HTML views, PDF and ePub downloads, according to the available data) and Abstracts Views on Vision4Press platform.
Data correspond to usage on the plateform after 2015. The current usage metrics is available 48-96 hours after online publication and is updated daily on week days.
Initial download of the metrics may take a while.