Fig. 7
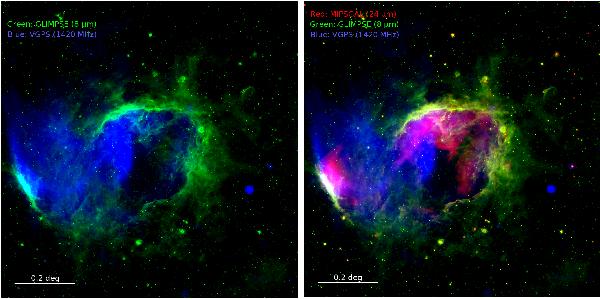
Comparison of the VGPS radio continuum at 1420 MHz/21 cm (blue) with the 8 μm (green) and 24 μm (red) emission. Left: 1420 MHz and 8 μm emission. The radio continuum follows the bubble outline and fills part of its interior. Right: same as left with added 24 μm emission. Inside the bubble, the radio continuum is well correlated with the 24 μm emission, except for the eastern part, where the 24 μm emission is absent and only the radio continuum is observed.
Current usage metrics show cumulative count of Article Views (full-text article views including HTML views, PDF and ePub downloads, according to the available data) and Abstracts Views on Vision4Press platform.
Data correspond to usage on the plateform after 2015. The current usage metrics is available 48-96 hours after online publication and is updated daily on week days.
Initial download of the metrics may take a while.