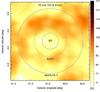
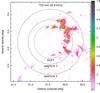
Fig. 4

Apertures for measuring the mass associated with bubble N107. The pixels lying within the apertures contribute to the measured masses. The dashed circles mark bubble N107 as was identified in the 8 μm emission by Churchwell et al. (2006). Left: H i line emission at 42.8 km s-1. The innermost circle (BG) is the region we used to derive the background emission. Right: 13CO line emission at 42.8 km s-1. We used two apertures to measure the molecular mass. Aperture 1 is the same as that for measuring the H i mass, while aperture 2 is smaller and covers only the immediate vicinity of the bubble.
Current usage metrics show cumulative count of Article Views (full-text article views including HTML views, PDF and ePub downloads, according to the available data) and Abstracts Views on Vision4Press platform.
Data correspond to usage on the plateform after 2015. The current usage metrics is available 48-96 hours after online publication and is updated daily on week days.
Initial download of the metrics may take a while.