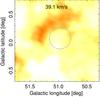
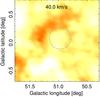
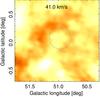
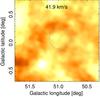
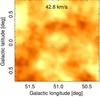
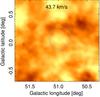
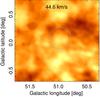
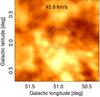
Fig. 2
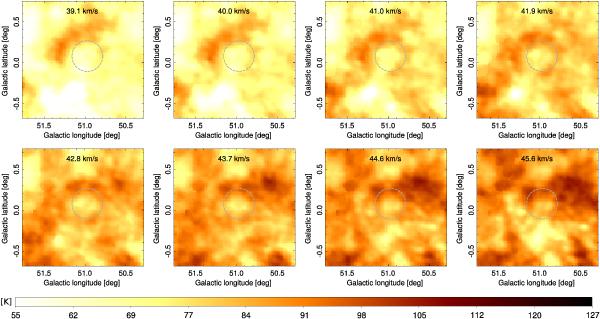
Brightness temperature maps of the H i line in several velocity channels. An outline of bubble N107 as given in the catalogue of Churchwell et al. (2006) is marked with the dashed grey circle. The channels 41.0 km s-1 and 41.9 km s-1 show morphology very similar to that of the 8 μm emission.

Current usage metrics show cumulative count of Article Views (full-text article views including HTML views, PDF and ePub downloads, according to the available data) and Abstracts Views on Vision4Press platform.
Data correspond to usage on the plateform after 2015. The current usage metrics is available 48-96 hours after online publication and is updated daily on week days.
Initial download of the metrics may take a while.