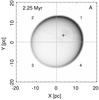
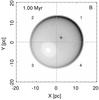
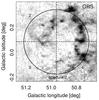
Fig. 10

Snapshots from the best fitting simulations from group A (left) and B (centre) and GRS observation (right). Shown is the brightness temperature of the 13CO line integrated over the radial velocities of ± 8 km s-1 relative to the radial velocity of the bubble centre. The images also show four sectors used to compare the angular mass distribution (see Sect. 4.3 and Eq. (21)). The plus sign (+) in pictures A and B marks the original expansion centre. Aperture 2, shown in the GRS picture, marks which region from the observed data we used for comparison with simulations.

Current usage metrics show cumulative count of Article Views (full-text article views including HTML views, PDF and ePub downloads, according to the available data) and Abstracts Views on Vision4Press platform.
Data correspond to usage on the plateform after 2015. The current usage metrics is available 48-96 hours after online publication and is updated daily on week days.
Initial download of the metrics may take a while.