Fig. 8
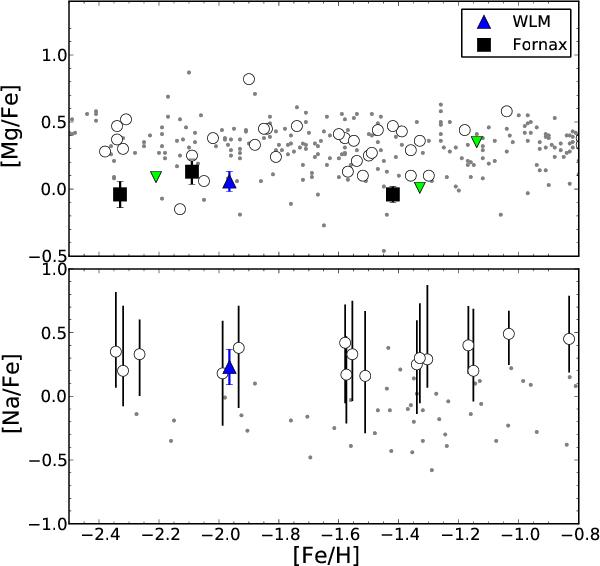
Abundances of Na and Mg. Large symbols with error bars are data from this paper and L12a, as indicated in the legend. Upside-down triangles (green in the online version) are data for M31 GCs (Colucci et al. 2009). In the top panel, open circles are mean abundances for Milky Way GCs from Pritzl et al. (2005). In the lower panel, open circles and the vertical lines represent the mean abundances and their range for Milky Way GCs from Carretta et al. (2009). Small grey dots are individual Milky Way stars (Venn et al. 2004 for Mg and Ishigaki et al. 2013 for Na.)
Current usage metrics show cumulative count of Article Views (full-text article views including HTML views, PDF and ePub downloads, according to the available data) and Abstracts Views on Vision4Press platform.
Data correspond to usage on the plateform after 2015. The current usage metrics is available 48-96 hours after online publication and is updated daily on week days.
Initial download of the metrics may take a while.