Free Access
Fig. 2
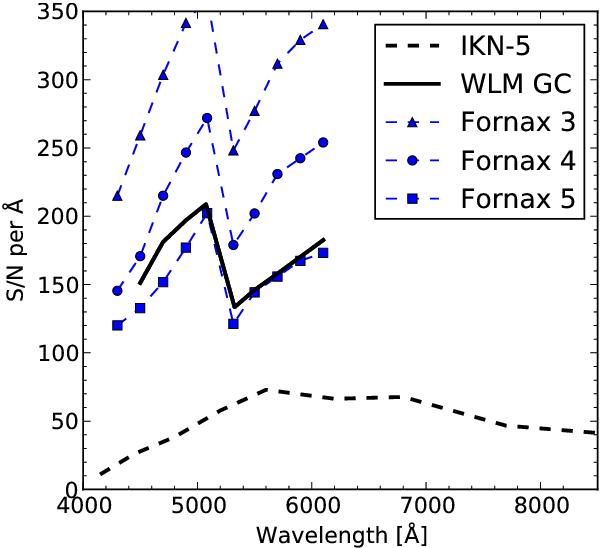
Signal-to-noise ratio of the spectra. Lines connect averages over 200 Å bins. The discontinuity at 5200 Å in the UVES spectra is caused by the different detectors. For reference, we have also included the GCs in the Fornax dSph (L12a).
Current usage metrics show cumulative count of Article Views (full-text article views including HTML views, PDF and ePub downloads, according to the available data) and Abstracts Views on Vision4Press platform.
Data correspond to usage on the plateform after 2015. The current usage metrics is available 48-96 hours after online publication and is updated daily on week days.
Initial download of the metrics may take a while.