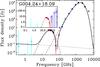
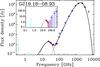
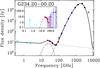
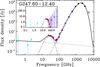
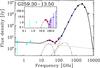
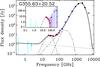
Fig. 8

SEDs for the sources with very significant AME and
 . Data points are shown as circles
with errors and are colour-coded for radio data (light blue), WMAP (red),
Planck (blue), and DIRBE/ IRAS (black). The best-fitting model of
free-free (dotted line), thermal dust (short-dashed line), CMB (triple-dot dashed
line), and spinning dust (dot-dashed line) is shown. Data included in the fit are
shown as filled circles, while the other data are unfilled. The residual spectrum,
after subtraction of free-free, synchrotron, CMB, and thermal dust components, is
shown in the insert. The best-fitting spinning dust model is also
shown.
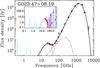
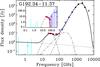
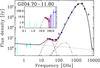
. Data points are shown as circles
with errors and are colour-coded for radio data (light blue), WMAP (red),
Planck (blue), and DIRBE/ IRAS (black). The best-fitting model of
free-free (dotted line), thermal dust (short-dashed line), CMB (triple-dot dashed
line), and spinning dust (dot-dashed line) is shown. Data included in the fit are
shown as filled circles, while the other data are unfilled. The residual spectrum,
after subtraction of free-free, synchrotron, CMB, and thermal dust components, is
shown in the insert. The best-fitting spinning dust model is also
shown.
Current usage metrics show cumulative count of Article Views (full-text article views including HTML views, PDF and ePub downloads, according to the available data) and Abstracts Views on Vision4Press platform.
Data correspond to usage on the plateform after 2015. The current usage metrics is available 48-96 hours after online publication and is updated daily on week days.
Initial download of the metrics may take a while.