Fig. 21
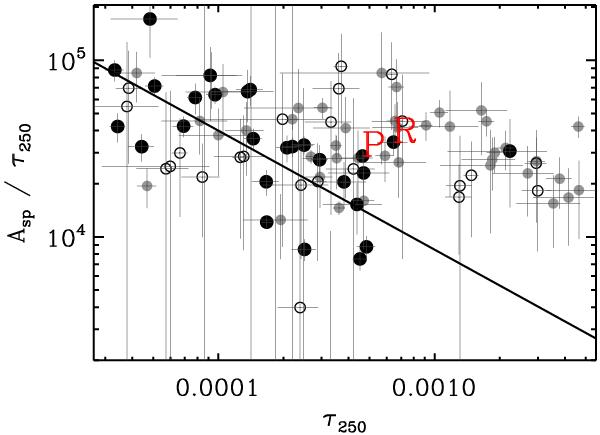
Ratio of AME amplitude (Asp) to dust optical depth (τ250), as a function of τ250. The symbols are as in Fig. 6. The Perseus (P) and ρ Ophiuchi (R) clouds are indicated. The solid line shows the best-fitting power law for the significant AME regions.
Current usage metrics show cumulative count of Article Views (full-text article views including HTML views, PDF and ePub downloads, according to the available data) and Abstracts Views on Vision4Press platform.
Data correspond to usage on the plateform after 2015. The current usage metrics is available 48-96 hours after online publication and is updated daily on week days.
Initial download of the metrics may take a while.