Fig. 19
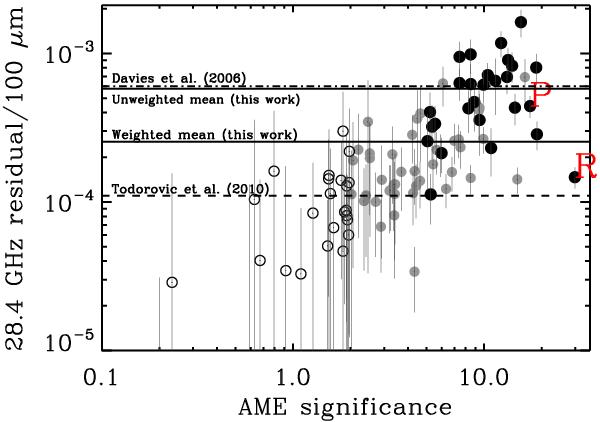
Ratio of 28.4 GHz residual to the 100 μm flux density as a function of the AME significance. The symbols are as in Fig. 6. The Perseus (P) and ρ Ophiuchi (R) clouds are indicated. The weighted and unweighted average ratios for the significant AME regions are shown as the solid horizontal lines. The average ratio from Todorović et al. (2010, dashed line) and Davies et al. (2006, dot-dashed line) are also shown.
Current usage metrics show cumulative count of Article Views (full-text article views including HTML views, PDF and ePub downloads, according to the available data) and Abstracts Views on Vision4Press platform.
Data correspond to usage on the plateform after 2015. The current usage metrics is available 48-96 hours after online publication and is updated daily on week days.
Initial download of the metrics may take a while.