Fig. 18
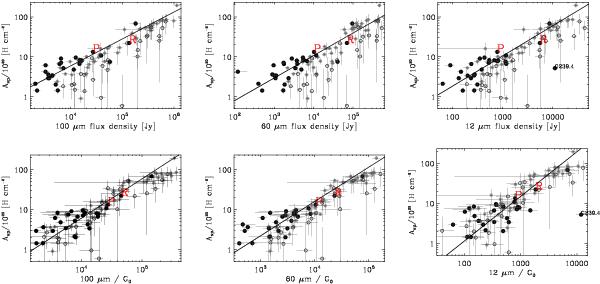
Top row: AME amplitude (Asp) as a function of the 100 μm (left), 60 μm (middle), and 12 μm (right) flux density. Bottom row: same as top row, except that the FIR flux densities have been divided by G0. Symbols are as in Fig. 6. The best-fitting slope fitted to the significant AME regions only is plotted. The Perseus (P) and ρ Ophiuchi (R) clouds are indicated. There is a strong correlation between the AME intensity and infrared tracers of dust, with an improved correlation after dividing by G0. At 12 μm the fit is made excluding the outlier source G239.40−4.70 (marked).
Current usage metrics show cumulative count of Article Views (full-text article views including HTML views, PDF and ePub downloads, according to the available data) and Abstracts Views on Vision4Press platform.
Data correspond to usage on the plateform after 2015. The current usage metrics is available 48-96 hours after online publication and is updated daily on week days.
Initial download of the metrics may take a while.