Fig. 5
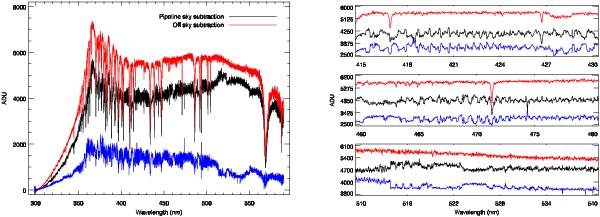
1D spectra extracted from the UVB arm, using the pipeline sky model (black) and a background extracted directly from the observation (red), when the sky emission lines are weak (or not observed). The blue spectrum shows the difference between the two methods. In the right panels, we zoom into three small wavelength regions, so that the sky modeling errors of the pipeline are clear.
Current usage metrics show cumulative count of Article Views (full-text article views including HTML views, PDF and ePub downloads, according to the available data) and Abstracts Views on Vision4Press platform.
Data correspond to usage on the plateform after 2015. The current usage metrics is available 48-96 hours after online publication and is updated daily on week days.
Initial download of the metrics may take a while.