Free Access
Fig. 4
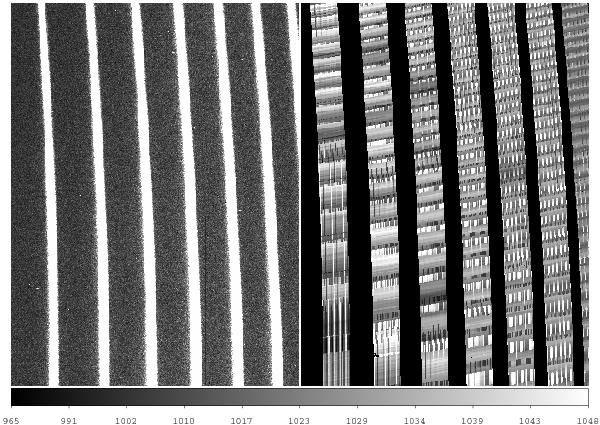
Example of background (“sky”) modeled by the pipeline from data observed in stare mode in the UVB arm, in which sky lines are nearly absent. Left panel: original raw frame. Right panel: sky frame generated by the pipeline scaled to the same intensity as the left panel. Note the very poor background model.
Current usage metrics show cumulative count of Article Views (full-text article views including HTML views, PDF and ePub downloads, according to the available data) and Abstracts Views on Vision4Press platform.
Data correspond to usage on the plateform after 2015. The current usage metrics is available 48-96 hours after online publication and is updated daily on week days.
Initial download of the metrics may take a while.