Free Access
Fig. 26
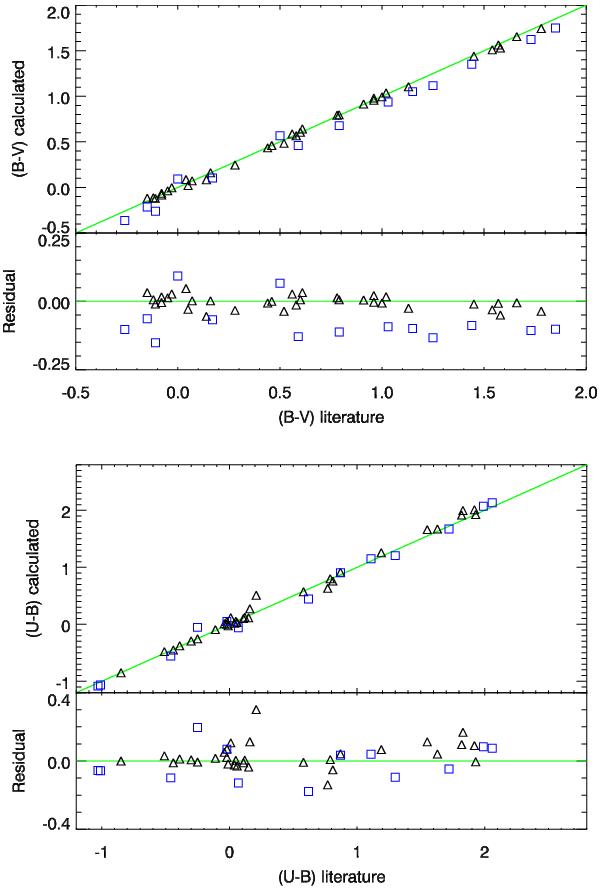
Comparison of synthetic (B − V) and (U − B) colors of XSL and the Bright Star Catalogue. The residuals are calculated as in Fig. 25b. Blue squares indicate those stars that likely have flux losses due to a lack of useful wide-slit observation.
This figure is made of several images, please see below:
Current usage metrics show cumulative count of Article Views (full-text article views including HTML views, PDF and ePub downloads, according to the available data) and Abstracts Views on Vision4Press platform.
Data correspond to usage on the plateform after 2015. The current usage metrics is available 48-96 hours after online publication and is updated daily on week days.
Initial download of the metrics may take a while.