Fig. 22
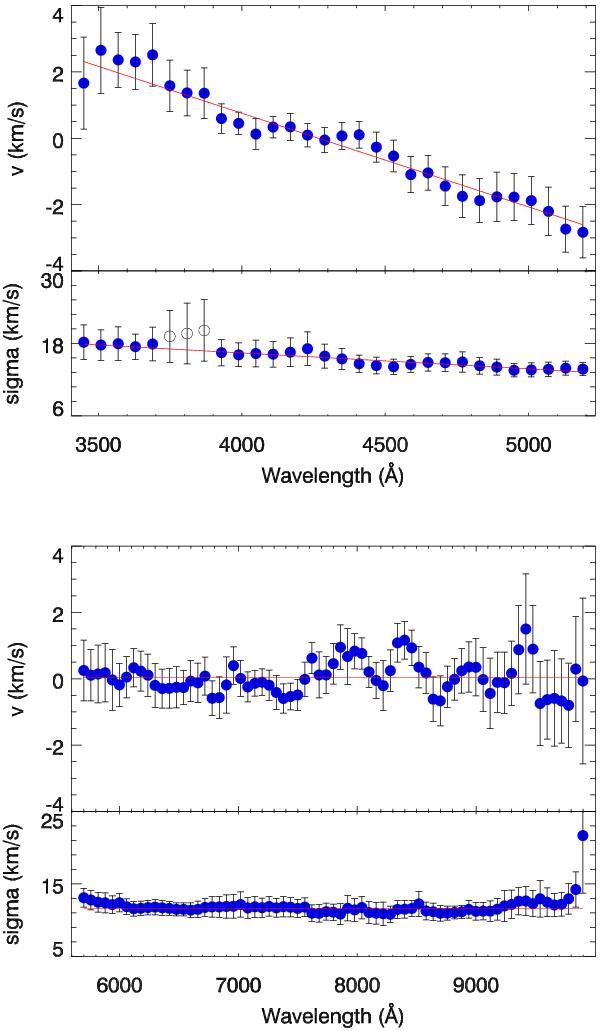
Average line-spread functions for the FGK stars (212 spectra) in the UVB (upper panel) and VIS (lower panel) arms. In each arm, the top panel shows the residual shift of the spectra (blue dots). The bottom panel shows the detected instrumental velocity dispersion. A simple first-order polynomial fit (red lines) of the line-spread function is marked in each panel. The error bars are the standard deviation in each wavelength bin. The three open circles show the region where two different flat field lamps are used in the UVB arm, which may result in larger uncertainties.
Current usage metrics show cumulative count of Article Views (full-text article views including HTML views, PDF and ePub downloads, according to the available data) and Abstracts Views on Vision4Press platform.
Data correspond to usage on the plateform after 2015. The current usage metrics is available 48-96 hours after online publication and is updated daily on week days.
Initial download of the metrics may take a while.