Free Access
Fig. 21
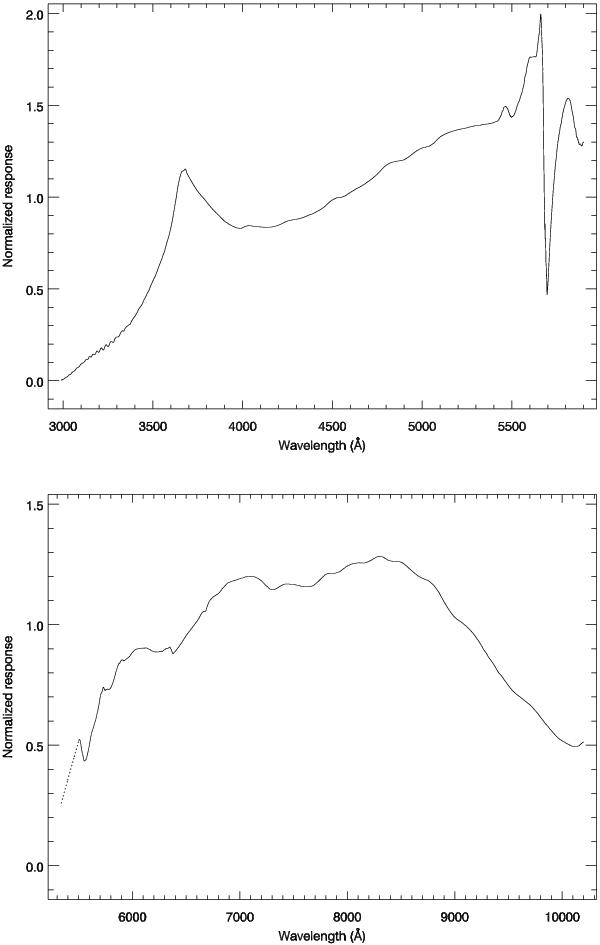
Average response curves in the UVB (upper panel) and VIS arm (lower panel). The dotted line in the VIS arm indicates a low signal-to-noise region, interpolated for display purposes. Dichroic features are shown in both UVB and VIS arms around 5600–5800 Å.
This figure is made of several images, please see below:
Current usage metrics show cumulative count of Article Views (full-text article views including HTML views, PDF and ePub downloads, according to the available data) and Abstracts Views on Vision4Press platform.
Data correspond to usage on the plateform after 2015. The current usage metrics is available 48-96 hours after online publication and is updated daily on week days.
Initial download of the metrics may take a while.