Free Access
Fig. 20
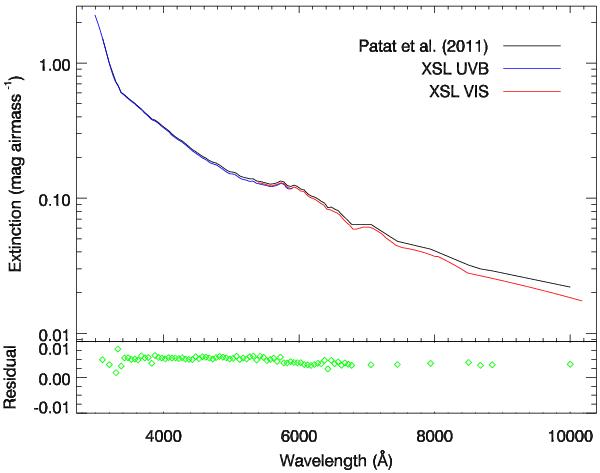
Extinction curve for XSL in the UVB arm (blue line) and the VIS arm (red line). The Paranal extinction curve of Patat et al. (2011) is shown as the black line for comparison. Lower panel shows the residual between XSL and Patat et al. (2011) calculated by the IRAF.standard procedure and applied to derive the XSL extinction.
Current usage metrics show cumulative count of Article Views (full-text article views including HTML views, PDF and ePub downloads, according to the available data) and Abstracts Views on Vision4Press platform.
Data correspond to usage on the plateform after 2015. The current usage metrics is available 48-96 hours after online publication and is updated daily on week days.
Initial download of the metrics may take a while.