Fig. 11
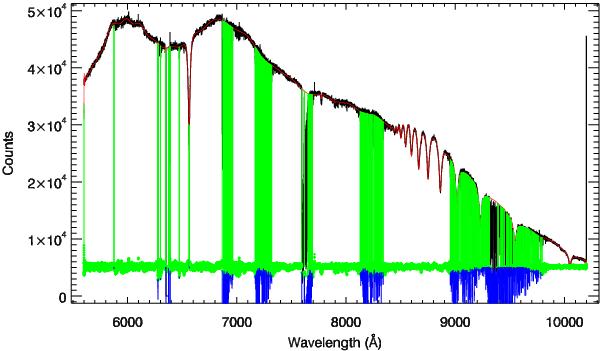
Extraction of the telluric absorption from the B8V star Hip012389. The black spectrum is the original 1D spectrum (without telluric or flux calibration). This spectrum is fit by a synthetic LTE spectrum from a model atmosphere in the pixels outside of the vertical green lines. The red spectrum represents this fit. The lower part of the plot shows the residuals from the best fit: green points represent regions of intrinsic stellar absorption, while blue points are (almost) the telluric absorption spectrum. We note that the residual between the best fit and the data is scaled to the view level. It is, therefore, not surprising that some features are below zero.
Current usage metrics show cumulative count of Article Views (full-text article views including HTML views, PDF and ePub downloads, according to the available data) and Abstracts Views on Vision4Press platform.
Data correspond to usage on the plateform after 2015. The current usage metrics is available 48-96 hours after online publication and is updated daily on week days.
Initial download of the metrics may take a while.