Fig. 16
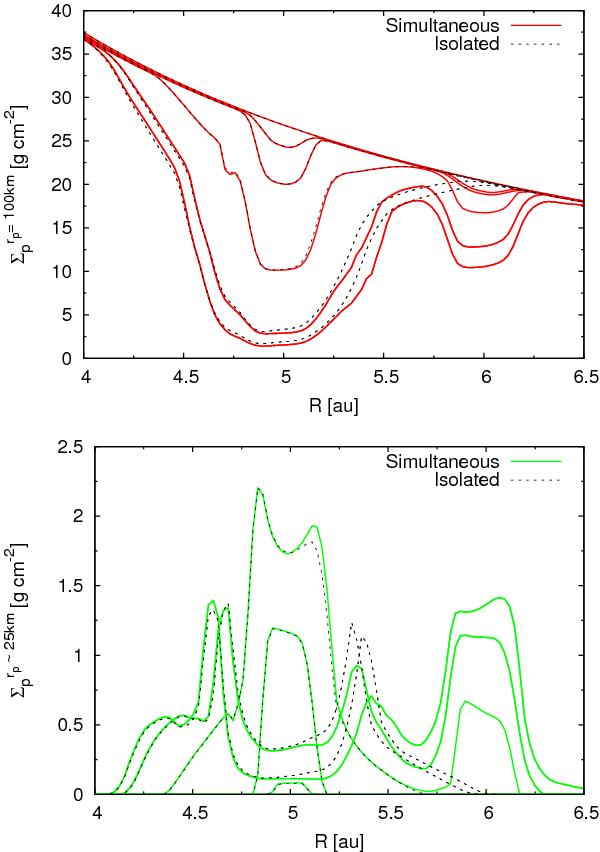
Top: time evolution of the radial profiles of the surface density of planetesimals of rp = 100 km when planetesimal fragmentation is considered with p = 5 / 3 and for a disk ten times more massive than the MMSN. Black dashed lines correspond to the isolated formation of a planet located at 5 au. Red solid lines correspond to the simultaneous formation of two planets located at 5 au and 6 au. The different lines correspond to different times: 0, 0.5, 1, 1.5, 2, and ~2.5 Myr. Eventually, the planetesimal surface density decreases in the neighborhood of both embryos. Bottom: same as top panel, but for fragments that most contribute into the total accretion rate, rp ~ 25 km. In this case, the profiles increase around 5 au for t = 0.5,1,1.5 Myr, but for t = 2, ~2.5 Myr profiles decrease because of accretion. The increments in the surface density around 6 au correspond to the profiles at times 1.5, 2, and ~2.5 Myr. (Color version online.)
Current usage metrics show cumulative count of Article Views (full-text article views including HTML views, PDF and ePub downloads, according to the available data) and Abstracts Views on Vision4Press platform.
Data correspond to usage on the plateform after 2015. The current usage metrics is available 48-96 hours after online publication and is updated daily on week days.
Initial download of the metrics may take a while.