Fig. 14
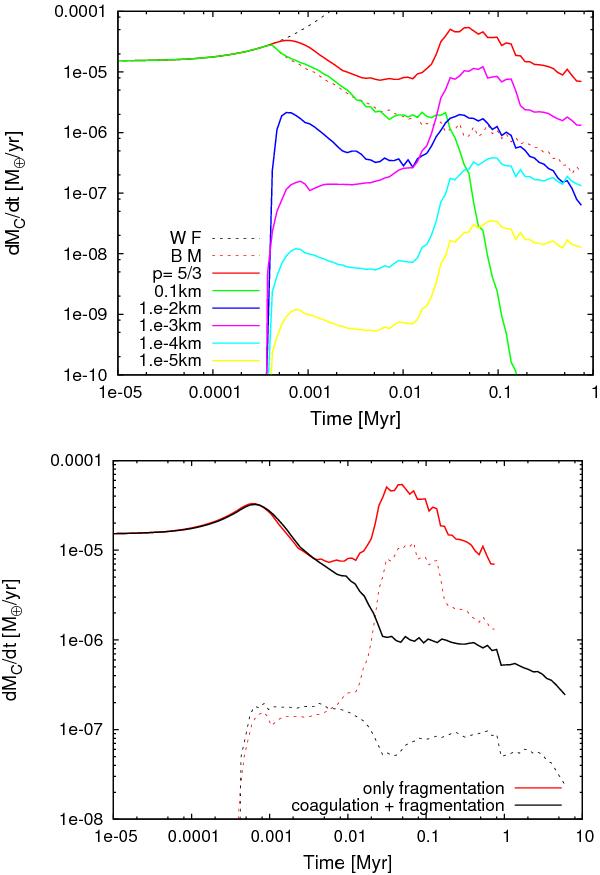
Top: planetesimal accretion rates for different planetesimal
sizes, for a disk ten times more massive then the MMSN, in which p = 5/3 and  km, as a function of
time. The dashed black line represents the total planetesimal accretion rate for the
case without planetesimal fragmentation (WF). The dashed red line represents the
total planetesimal accretion rate for the case with planetesimal fragmentation in
which p
is calculated with Eq. (31), our
basis model (BM). The solid red line represents the total planetesimal accretion
rate for the case with planetesimal fragmentation with p = 5/3. Bottom: time evolution of the total
planetesimal accretion rates (solid lines) and the accretion rates of fragments of 1
m (dashed lines) for the case where only planetesimal fragmentation is considered
(red lines) and for the case in which planetesimal coagulation and fragmentation are
considered (black lines). The plot corresponds to a disk ten times more massive then
the MMSN and for the case of km. (Color version
online.)
km, as a function of
time. The dashed black line represents the total planetesimal accretion rate for the
case without planetesimal fragmentation (WF). The dashed red line represents the
total planetesimal accretion rate for the case with planetesimal fragmentation in
which p
is calculated with Eq. (31), our
basis model (BM). The solid red line represents the total planetesimal accretion
rate for the case with planetesimal fragmentation with p = 5/3. Bottom: time evolution of the total
planetesimal accretion rates (solid lines) and the accretion rates of fragments of 1
m (dashed lines) for the case where only planetesimal fragmentation is considered
(red lines) and for the case in which planetesimal coagulation and fragmentation are
considered (black lines). The plot corresponds to a disk ten times more massive then
the MMSN and for the case of km. (Color version
online.)
Current usage metrics show cumulative count of Article Views (full-text article views including HTML views, PDF and ePub downloads, according to the available data) and Abstracts Views on Vision4Press platform.
Data correspond to usage on the plateform after 2015. The current usage metrics is available 48-96 hours after online publication and is updated daily on week days.
Initial download of the metrics may take a while.