Fig. 11
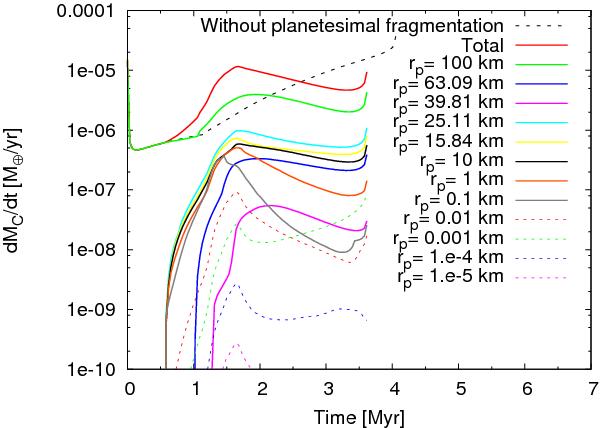
Planetesimal accretion rates as a function of time for an embryo located at 5 au in a disk ten times more massive than the MMSN, where initially all the solid mass is deposited in planetesimals with a radius of 100 km. The dashed black curve represents the total planetesimal accretion rate for the case without planetesimal fragmentation. The red solid curve represents the total planetesimal accretion rate when p = 5/3 is a fixed value for all collisions. We also plot the planetesimal accretion rates for the different planetesimal sizes for p = 5/3. (Color version online.)
Current usage metrics show cumulative count of Article Views (full-text article views including HTML views, PDF and ePub downloads, according to the available data) and Abstracts Views on Vision4Press platform.
Data correspond to usage on the plateform after 2015. The current usage metrics is available 48-96 hours after online publication and is updated daily on week days.
Initial download of the metrics may take a while.