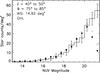
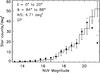
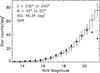
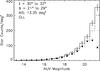
Fig. 7

Comparison of model-predictions (solid line) with the UV-IR stars (solid circles) and GALEX+SDSS stars (open circles) as a function of the GALEX NUV magnitude for the regions at the GHL (7a), the GP (7b), the GAR (7c), and the GLL (7d). In plot 7d, the solid line represents the model NUV star counts produced assuming the standard diffuse extinction (as in other fields) whereas the dashed line is the same after correcting the extinction using the value from the Schlegel et al. (1998) maps (see Sect. 5). The model error bars shown in the plots are due to Poisson noise.
Current usage metrics show cumulative count of Article Views (full-text article views including HTML views, PDF and ePub downloads, according to the available data) and Abstracts Views on Vision4Press platform.
Data correspond to usage on the plateform after 2015. The current usage metrics is available 48-96 hours after online publication and is updated daily on week days.
Initial download of the metrics may take a while.