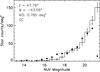
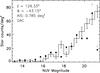
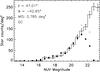
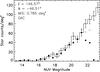
Fig. 5
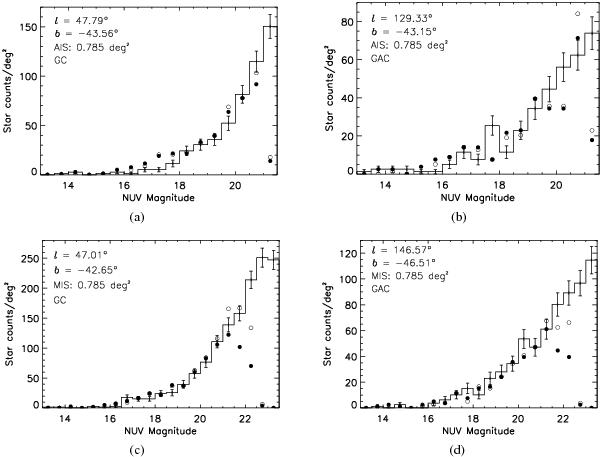
Comparison of the UV-IR stars (solid circles) with model-predictions (solid line) as a function of NUV magnitudes for the regions at the southern intermediate Galactic latitudes. The open circles represent the GALEX+SDSS stars. The plots are for the fields towards the GC and the GAC for individual GALEX AIS and MIS tiles, each covering an area of 0.785 deg2 (fields 1–4 in Table 1). The error bars shown in the model star counts are due to Poisson noise, while the asymmetric errors in the observed star counts are not shown in the plot.
Current usage metrics show cumulative count of Article Views (full-text article views including HTML views, PDF and ePub downloads, according to the available data) and Abstracts Views on Vision4Press platform.
Data correspond to usage on the plateform after 2015. The current usage metrics is available 48-96 hours after online publication and is updated daily on week days.
Initial download of the metrics may take a while.