Fig. 3
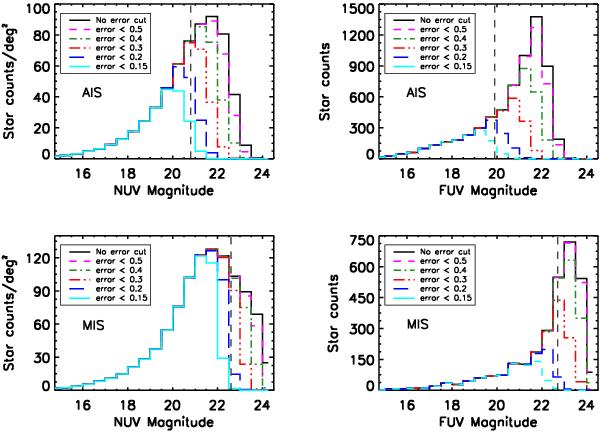
Distribution of the UV-IR stars as a function of the GALEX NUV and FUV magnitudes for AIS and MIS. The stellar sources obtained after applying various magnitude error cuts are shown by different line styles in colours. The vertical dashed lines represent the respective 5σ detection limits of the GALEX bands for typical exposure times as mentioned in Sect. 2.
Current usage metrics show cumulative count of Article Views (full-text article views including HTML views, PDF and ePub downloads, according to the available data) and Abstracts Views on Vision4Press platform.
Data correspond to usage on the plateform after 2015. The current usage metrics is available 48-96 hours after online publication and is updated daily on week days.
Initial download of the metrics may take a while.