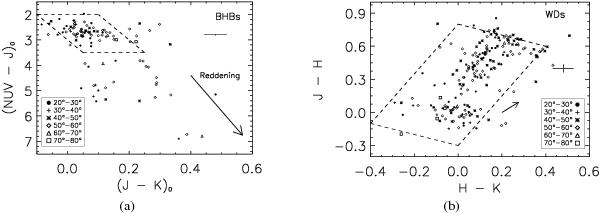
Fig. 13

a)(J − K)0 versus (NUV − J)0 colour–colour diagram for the BHB candidates of the combined AIS fields given in Table 1. The parallelogram encloses the area occupied by the BHB samples of Kinman et al. (2007). The sources at various latitudes are represented by different symbols. b)H − K versus J − H colour–colour diagram for the WD candidates of the combined AIS fields in Table 1. The dashed line rectangle encloses the area used from Hoard et al. (2007). A reddening vector (the arrow) of AV = 1 mag and the mean error bars of the colours are displayed in both the diagrams.
Current usage metrics show cumulative count of Article Views (full-text article views including HTML views, PDF and ePub downloads, according to the available data) and Abstracts Views on Vision4Press platform.
Data correspond to usage on the plateform after 2015. The current usage metrics is available 48-96 hours after online publication and is updated daily on week days.
Initial download of the metrics may take a while.


