Fig. 9
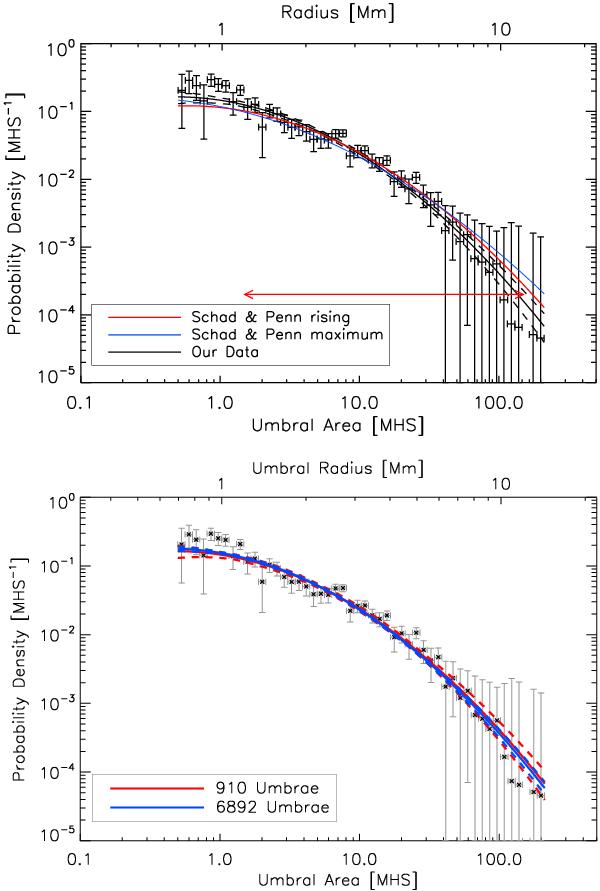
Umbral size distribution. Error bars in x-direction mark the width of the bins. The error bars in y-direction are proportional to the inverse of the square root of entries in each bin. Top: the black data points and curve show our data and the lognormal fit, respectively. The colored curves are adopted from SP and show their fit (after normalizing its area) to the rising phase (red) and maximum (blue) of solar cycle 23. The red arrow marks the data range used by SP. Bottom: comparison of the complete sample of 6892 umbrae and the unique sample of 910 umbrae (no repetition). The dashed lines give the one-sigma errors of the fit.
Current usage metrics show cumulative count of Article Views (full-text article views including HTML views, PDF and ePub downloads, according to the available data) and Abstracts Views on Vision4Press platform.
Data correspond to usage on the plateform after 2015. The current usage metrics is available 48-96 hours after online publication and is updated daily on week days.
Initial download of the metrics may take a while.