Fig. 4
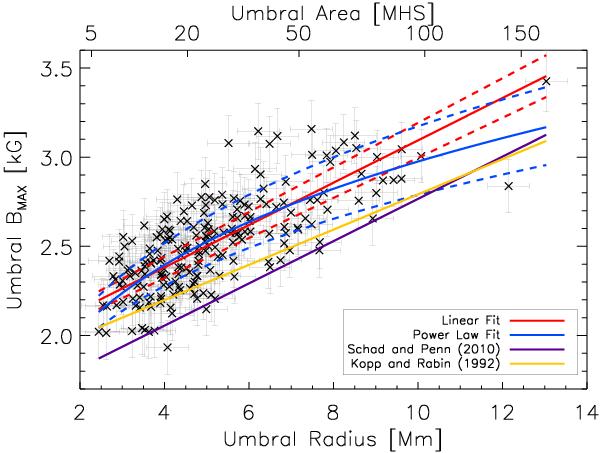
Variation of umbral maximum field strength as a function of radius. Parameters of a linear fit (solid red line) and power law fit (solid blue line) and correlation coefficients are given in Table 1. The dashed lines mark the one-sigma confidence level for each fit. The yellow and purple lines mark the adopted linear fits from Kopp & Rabin (1992) and SP, respectively. The upper x-axis shows the area corresponding to the given radius.
Current usage metrics show cumulative count of Article Views (full-text article views including HTML views, PDF and ePub downloads, according to the available data) and Abstracts Views on Vision4Press platform.
Data correspond to usage on the plateform after 2015. The current usage metrics is available 48-96 hours after online publication and is updated daily on week days.
Initial download of the metrics may take a while.