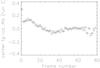
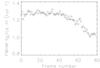
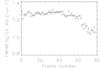
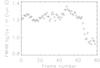
Fig. 8
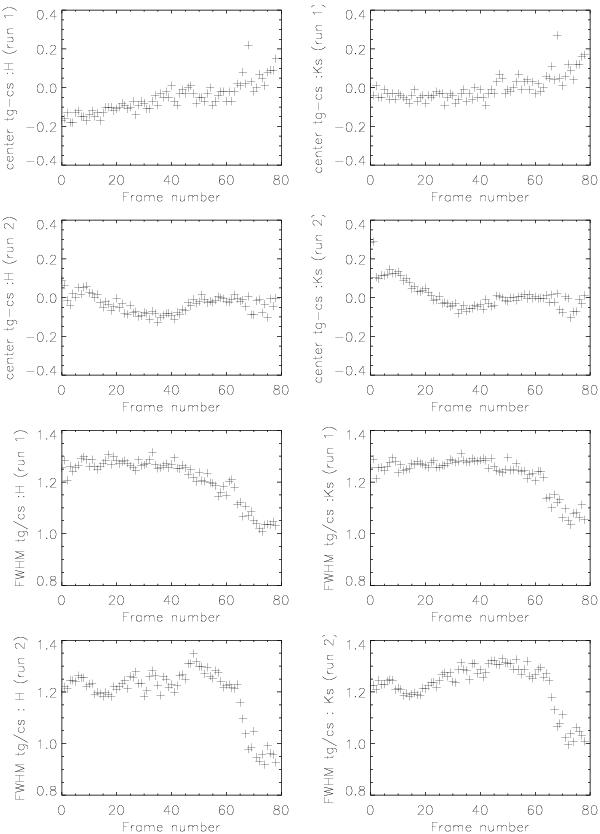
First set of graphs (top four panels): changes in the distance between the target and comparison along the slit for two runs and two different wavelengths corresponding to center of the H and KS filters. The second set of plots (bottom four panels) depicts a ratio of FWHMs of the target and the comparison for first two runs for center pixels of H and KS wavelengths.
Current usage metrics show cumulative count of Article Views (full-text article views including HTML views, PDF and ePub downloads, according to the available data) and Abstracts Views on Vision4Press platform.
Data correspond to usage on the plateform after 2015. The current usage metrics is available 48-96 hours after online publication and is updated daily on week days.
Initial download of the metrics may take a while.