Fig. 5
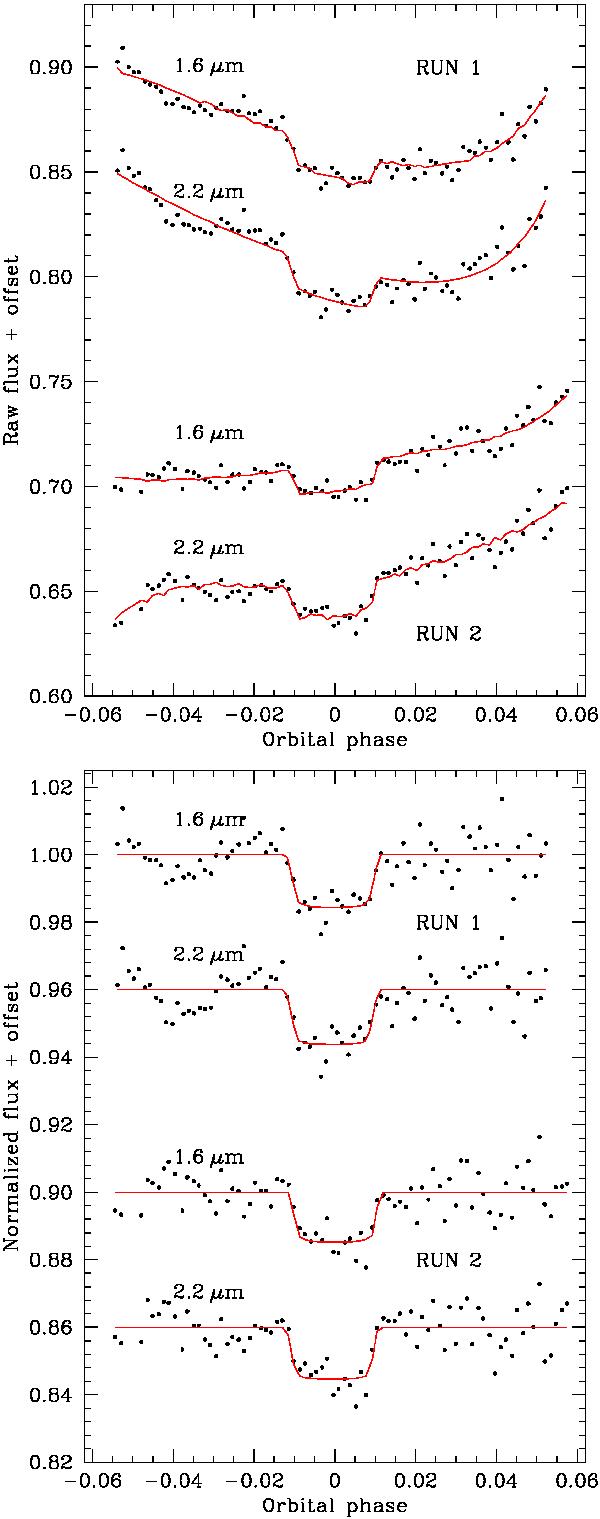
H (1.6 μm) and KS (2.2 μm) GJ 1214 b spectrophotometric series obtained from integrating the flux of the SofI spectra within the H and KS bands. Top: raw light curves, with the best-fitting transit models in red. Bottom: de-trended light curves with the best-fitting models. This figure is available in color in electronic form.
Current usage metrics show cumulative count of Article Views (full-text article views including HTML views, PDF and ePub downloads, according to the available data) and Abstracts Views on Vision4Press platform.
Data correspond to usage on the plateform after 2015. The current usage metrics is available 48-96 hours after online publication and is updated daily on week days.
Initial download of the metrics may take a while.