Fig. 12
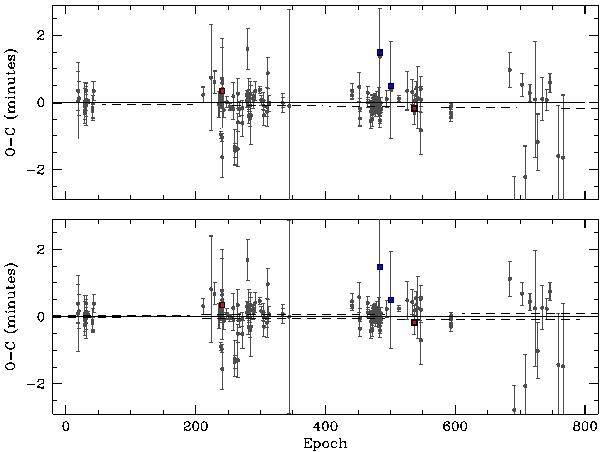
Top: observed-minus-calculated (O–C) diagram for the whole set of transit timing available to date in the literature, calculated on the ephemeris given by Bean et al. (2011). Our measurements are drawn as filled squares and in addition highlighted by colors in the online version. The dashed line represents the new ephemeris calculated in this work. Bottom: same data set after removing the new ephemeris, including its 1-σ errors (dashed lines).
Current usage metrics show cumulative count of Article Views (full-text article views including HTML views, PDF and ePub downloads, according to the available data) and Abstracts Views on Vision4Press platform.
Data correspond to usage on the plateform after 2015. The current usage metrics is available 48-96 hours after online publication and is updated daily on week days.
Initial download of the metrics may take a while.