Free Access
Fig. 11
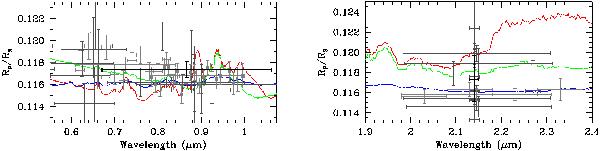
Left: zoom-in from Fig. 10 for the optical region around our I-Bessel measurements. Right: K-band region of spectra around our 2.14 μm observation. Our measurement points are represented by dark circles, while gray points follow the description in Fig. 10. This figure is available in color in electronic form.
This figure is made of several images, please see below:
Current usage metrics show cumulative count of Article Views (full-text article views including HTML views, PDF and ePub downloads, according to the available data) and Abstracts Views on Vision4Press platform.
Data correspond to usage on the plateform after 2015. The current usage metrics is available 48-96 hours after online publication and is updated daily on week days.
Initial download of the metrics may take a while.