Fig. 10
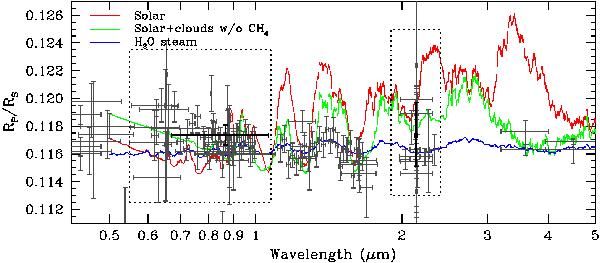
Updated best fit atmospheric models reported in Miller-Ricci Kempton et al. (2012), including all current observational data. The models shown were smoothed for the sake of clarity. Light-gray points represent spectrophotometric measurements, and dark-gray points represent photometric measurements. The horizontal extension of the bars represents the wavelength coverage of the point, instead of an error associated with the observation. Black points represent our SOAR measurements. The dashed windows represent the zoomed-in regions displayed in Fig. 11. This figure is available in color in electronic form.
Current usage metrics show cumulative count of Article Views (full-text article views including HTML views, PDF and ePub downloads, according to the available data) and Abstracts Views on Vision4Press platform.
Data correspond to usage on the plateform after 2015. The current usage metrics is available 48-96 hours after online publication and is updated daily on week days.
Initial download of the metrics may take a while.