Free Access
Fig. 8
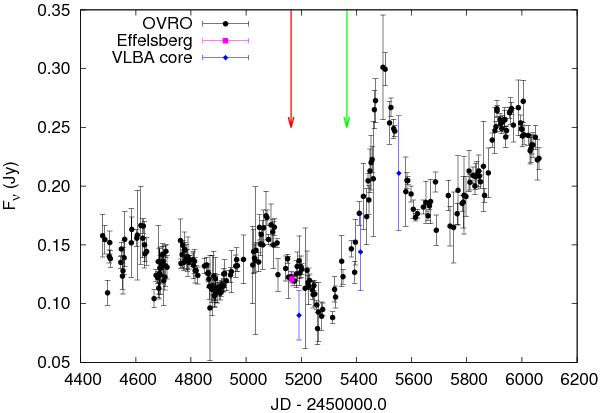
Radio lightcurve at 15 GHz obtained with the OVRO 40 m telescope (points) supplemented with two 14.6 GHz measurements obtained with the Effelsberg 100 m telescope (square). VLBA measurements of the core (component C0, Table 6) are indicated as diamonds. The two arrows mark the peaks of the γ-ray flares observed by Fermi.
Current usage metrics show cumulative count of Article Views (full-text article views including HTML views, PDF and ePub downloads, according to the available data) and Abstracts Views on Vision4Press platform.
Data correspond to usage on the plateform after 2015. The current usage metrics is available 48-96 hours after online publication and is updated daily on week days.
Initial download of the metrics may take a while.