Free Access
Fig. 5
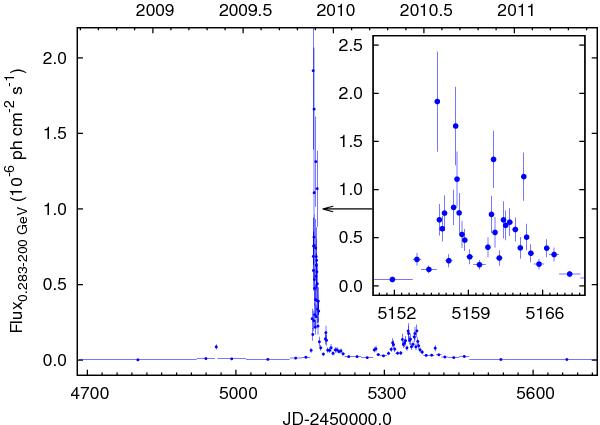
Fermi/LAT lightcurve constructed with the adaptive binning method (Lott et al. 2012). The magnified plot of Flare 1 is shown in the insert. The energy range for this lightcurve is chosen to minimize the uncertainties in time and flux, while the lightcurve was Fig. 4 is given in the commonly used E> 100 MeV energy range.
Current usage metrics show cumulative count of Article Views (full-text article views including HTML views, PDF and ePub downloads, according to the available data) and Abstracts Views on Vision4Press platform.
Data correspond to usage on the plateform after 2015. The current usage metrics is available 48-96 hours after online publication and is updated daily on week days.
Initial download of the metrics may take a while.