Free Access
Fig. 4
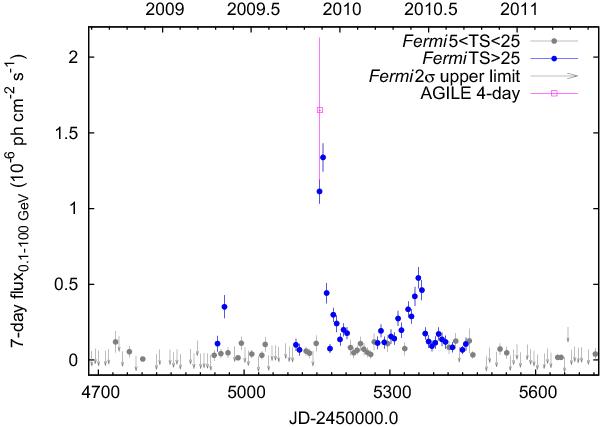
Weekly binned Fermi/LAT lightcurve. Blue filled circles are values with TS > 25, gray filled circles are values with 5 < TS < 25, and gray arrows indicate 2σ upper limits for time bins with no significant detections (TS < 5). A four-day integrated AGILE data point is added as an open box for comparison.
Current usage metrics show cumulative count of Article Views (full-text article views including HTML views, PDF and ePub downloads, according to the available data) and Abstracts Views on Vision4Press platform.
Data correspond to usage on the plateform after 2015. The current usage metrics is available 48-96 hours after online publication and is updated daily on week days.
Initial download of the metrics may take a while.