Free Access
Fig. 10
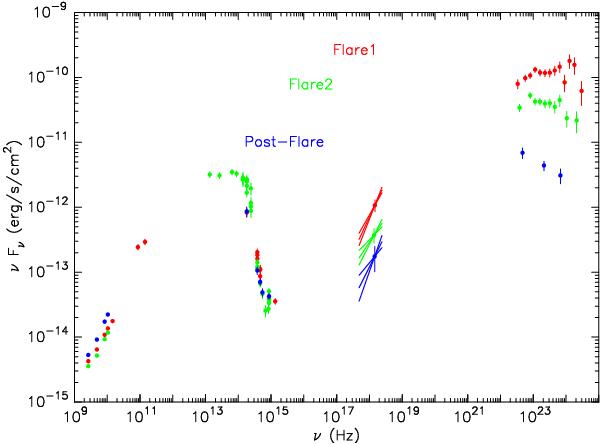
Quasi-simultaneous radio to γ-ray SED of GB 1310+487 during the two flaring episodes and the post-flare period covered by our multiwavelength observations. The time intervals corresponding to these events are defined in Table 1.
Current usage metrics show cumulative count of Article Views (full-text article views including HTML views, PDF and ePub downloads, according to the available data) and Abstracts Views on Vision4Press platform.
Data correspond to usage on the plateform after 2015. The current usage metrics is available 48-96 hours after online publication and is updated daily on week days.
Initial download of the metrics may take a while.