Fig. 15
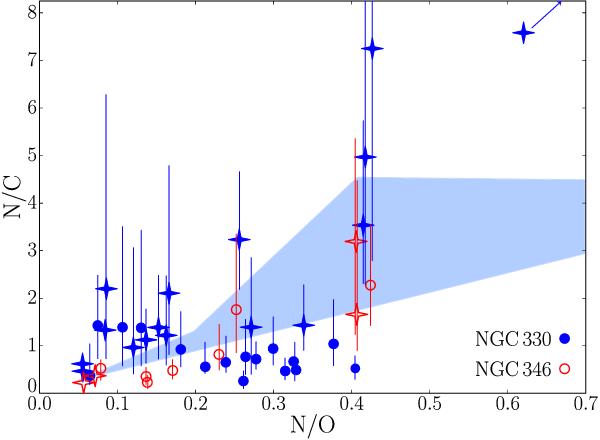
N/C vs. N/O abundances (in numbers) for stars in NGC 330 (filled blue symbols) and NGC 346 (open red symbols) in the SMC (Hunter et al. 2009). Blue giants and blue supergiants are indicated by crosses and MS stars by circles. The star NGC 330–004 with N/C = 13.2 and N/O = 0.955 is not indicated on this plot. The domain predicted by the models by Brott et al. (2011) in Fig. 8 is shown in blue. The initial N/C and N/O ratios are 0.134 and 0.033, respectively, as given in Sect. 2.2. The error bars on the observed N/C ratios are indicated. The error bars on the N/O ratios are of the same order of magnitude.
Current usage metrics show cumulative count of Article Views (full-text article views including HTML views, PDF and ePub downloads, according to the available data) and Abstracts Views on Vision4Press platform.
Data correspond to usage on the plateform after 2015. The current usage metrics is available 48-96 hours after online publication and is updated daily on week days.
Initial download of the metrics may take a while.