Fig. 13
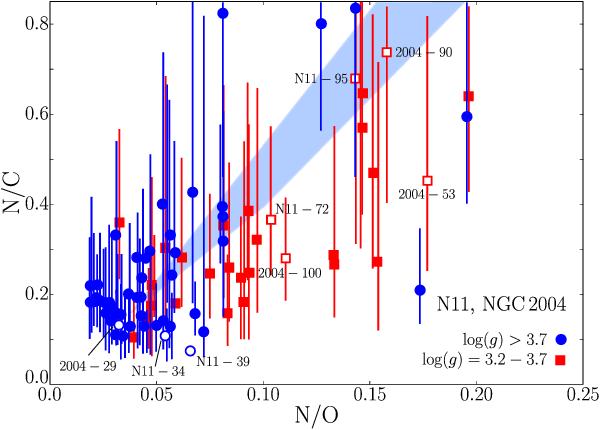
N/C vs. N/O abundances (in numbers) for the MS stars (stars with log g> 3.20) in the LMC open clusters N 11 and NGC 2004 from observations by Hunter et al. (2009). The open symbols represent the stars given in Table 1. The blue shaded area indicates the domain predicted by the models by Brott et al. (2011) of Fig. 6. The initial N/C and N/O ratios are 0.141 and 0.035, respectively, as given in Sect. 3.2. The error bars on the observed N/C ratios are indicated. The error bars on the N/O ratios are of the same order of magnitude.
Current usage metrics show cumulative count of Article Views (full-text article views including HTML views, PDF and ePub downloads, according to the available data) and Abstracts Views on Vision4Press platform.
Data correspond to usage on the plateform after 2015. The current usage metrics is available 48-96 hours after online publication and is updated daily on week days.
Initial download of the metrics may take a while.