Fig. 7
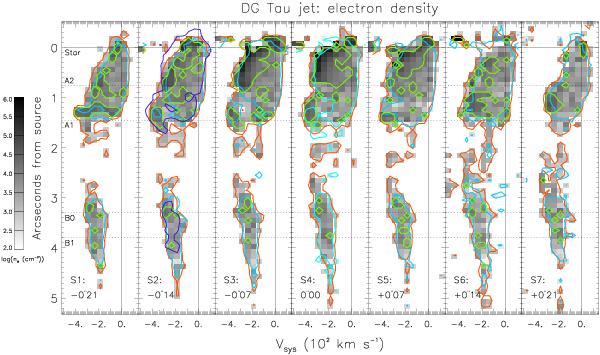
Position-velocity plots of the logarithm of the electron density ne. Contours indicate regions inside which: cyan – [S ii]λ6716 ≥ 3σ; orange – [S ii]λ6731 ≥ 3σ; green – [S ii]31/16 ratio at the high density limit. Where only [S ii]λ6731 ([S ii]λ6731) ≥ 3σ, the derived ne is a lower (upper) limit. Inside the green contours ne is derived with the modified HDL-BE procedure (cf. Sect. 2.2).
Current usage metrics show cumulative count of Article Views (full-text article views including HTML views, PDF and ePub downloads, according to the available data) and Abstracts Views on Vision4Press platform.
Data correspond to usage on the plateform after 2015. The current usage metrics is available 48-96 hours after online publication and is updated daily on week days.
Initial download of the metrics may take a while.