Free Access
Fig. 4
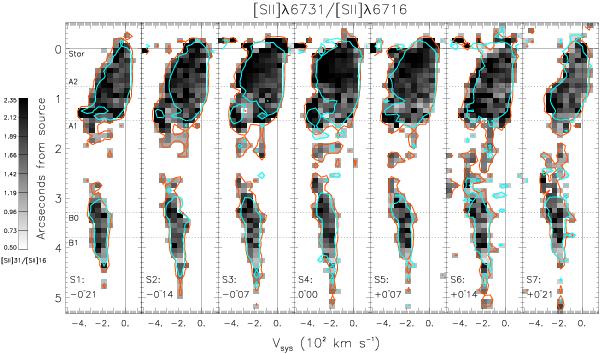
Position-velocity plots of the [S ii]λ6731/[S ii]λ6716 line ratio in linear greyscale. Cyan and orange contours indicate the [S ii]λ6716 and [S ii]λ6731 emission at 3σ, respectively. Where only one of the two lines is above the 3σ threshold the upper/lower limit of the line ratio is reported.
Current usage metrics show cumulative count of Article Views (full-text article views including HTML views, PDF and ePub downloads, according to the available data) and Abstracts Views on Vision4Press platform.
Data correspond to usage on the plateform after 2015. The current usage metrics is available 48-96 hours after online publication and is updated daily on week days.
Initial download of the metrics may take a while.