Fig. 16
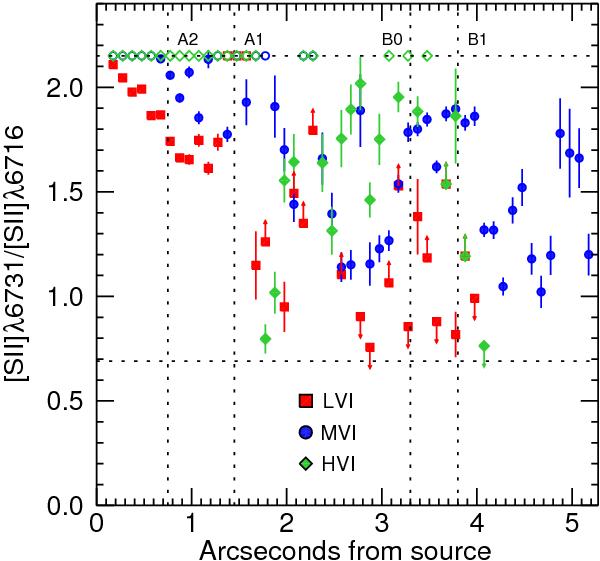
1D profile of the [S ii]31/16 ratio along the flow, derived from integration of the line surface brightness across the jet and over each velocity interval. Horizontal dashed lines indicate upper and lower density limits on validity of the ratio as a ne diagnostic. Empty symbols mark positions and velocities for which the modified BE-technique has been applied. Upper and lower limits arise when one of the lines is undetected, and so its flux has been set to 3σ.
Current usage metrics show cumulative count of Article Views (full-text article views including HTML views, PDF and ePub downloads, according to the available data) and Abstracts Views on Vision4Press platform.
Data correspond to usage on the plateform after 2015. The current usage metrics is available 48-96 hours after online publication and is updated daily on week days.
Initial download of the metrics may take a while.