Fig. 1
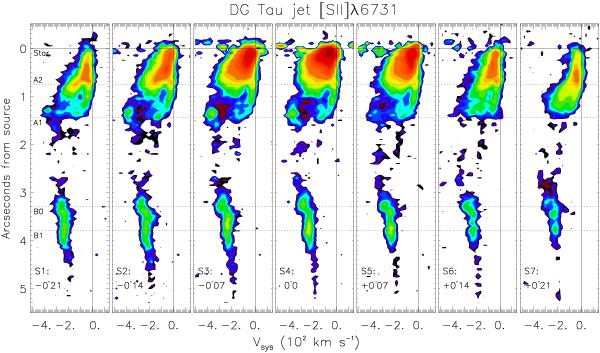
Continuum-subtracted HST/STIS position-velocity (PV) plots of the jet from DG Tau, in [S ii]λ6731 emission in slit positions S1 to S7 (south-east to north-west). Contours are from 1.1 × 10⁻¹⁵ erg s-1 arcsec-2 cm-2 Å-1 (3σ), with a ratio of 22/5. The solid lines mark the position of the star and zero velocity, while dashed lines mark the positions of identified features in images of this flow (see text).
Current usage metrics show cumulative count of Article Views (full-text article views including HTML views, PDF and ePub downloads, according to the available data) and Abstracts Views on Vision4Press platform.
Data correspond to usage on the plateform after 2015. The current usage metrics is available 48-96 hours after online publication and is updated daily on week days.
Initial download of the metrics may take a while.