Fig. 2
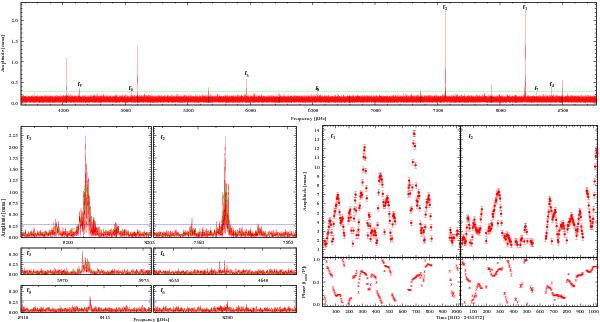
FT of the full Kepler dataset of KIC 2991276 (upper). Magnifications of the regions for the most significant peaks are shown in the panels on the lower left. The 5σ level is plotted as a line in each panel, and the Lorentzian fit for the most significant modes are shown as curves. In the lower right-hand panels, the amplitude and phase for the two main modes are plotted for consecutive 20-day chunks. For the amplitude/phase fits, the frequency was kept constant, and points with amplitudes of less than 1.5 mma were dropped.
Current usage metrics show cumulative count of Article Views (full-text article views including HTML views, PDF and ePub downloads, according to the available data) and Abstracts Views on Vision4Press platform.
Data correspond to usage on the plateform after 2015. The current usage metrics is available 48-96 hours after online publication and is updated daily on week days.
Initial download of the metrics may take a while.